Despite Hurricanes Harvey and Irma, the latest unemployment rates have remained below the 5% mark that President Barack Obama achieved. The unemployment rates across the US have been dipping constantly with occasional minute spikes. In a recent report released by the U.S. Bureau of Labor Statistics (BLS), it showed a 0.2% drop in the unemployment rates for September, bringing it to 4.2%. Despite a decline of 33,000 non-farm jobs, the total number of people unemployed has dropped by 331,000 to 6.8 million. There has been an improvement in the total number and the rate of decline of unemployed persons when compared to the year-over-year improvements.
In the foodservice sector, BLS researchers notice a fall in employment that has been factored by Hurricanes Irma and Harvey. The sector alone has contributed towards adding an average of 24,000 job opportunities every month.
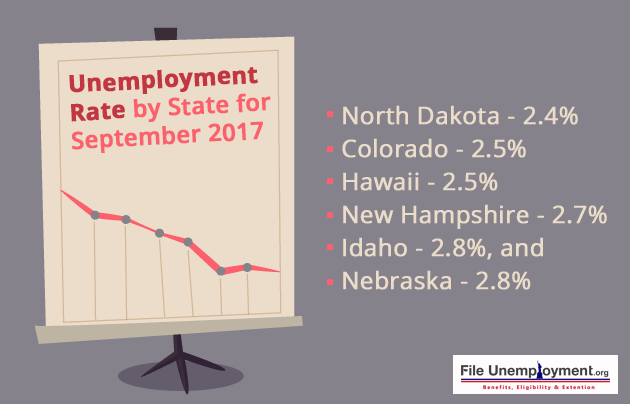
Unemployment Rate by State for September 2017
The overall unemployment rate for September was expected to not be a pretty picture. However, the BLS report further added that the overview for the month looked positive with an increase of 0.3% in the ratio of population-to-unemployment, bringing it to 60.4%. The current labor force participation rate of 63.1% has continued the year-long trend showing a small improvement.
The report also contained additional information about the employment situation for September 2017.
- Non-farm employment has been adding 172,000 jobs per month on an average
- Employment in transportation and warehousing grew by 22,000 jobs
- There was no change in Manufacturing employment which broke the industry’s trend of adding an average of 14,000 jobs for the past 10 months
- The 40.7 hour average workweek remained the same throughout manufacturing and even overtime remained unchanged at 3.3 hours. The value of non-farm sectors is 6 hours lesser than that of manufacturing sectors
- Average hourly earnings rose by $0.12 making it $26.55. The average hourly pay, however, increased by $0.74 or 2.9% when compared against that of September 2016
Top 5 States with the Lowest Unemployment Rate
The states with the top 5 ranks for the lowest unemployment rates for September 2017 are as follow:
- North Dakota – 2.4%
- Colorado – 2.5%
- Hawaii – 2.5%
- New Hampshire – 2.7%
- Idaho – 2.8%, and
- Nebraska – 2.8%
Unemployment Rates September 2017 with Ranking
(Seasonally adjusted)
| State | September 2017 Rate (%) | Rank in Unemployment Rate
(Lowest to Highest) |
| North Dakota | 2.4 | 1 |
| Colorado | 2.5 | 2 |
| Hawaii | 2.5 | 2 |
| New Hampshire | 2.7 | 4 |
| Idaho | 2.8 | 5 |
| Nebraska | 2.8 | 5 |
| Vermont | 2.9 | 7 |
| Tennessee | 3.0 | 8 |
| Iowa | 3.2 | 9 |
| South Dakota | 3.4 | 10 |
| Utah | 3.4 | 10 |
| Arkansas | 3.5 | 12 |
| Wisconsin | 3.5 | 12 |
| Maine | 3.7 | 14 |
| Minnesota | 3.7 | 14 |
| Virginia | 3.7 | 14 |
| Alabama | 3.8 | 17 |
| Florida | 3.8 | 17 |
| Indiana | 3.8 | 17 |
| Kansas | 3.8 | 17 |
| Maryland | 3.8 | 17 |
| Missouri | 3.8 | 17 |
| Massachusetts | 3.9 | 23 |
| Montana | 3.9 | 23 |
| South Carolina | 3.9 | 23 |
| Texas | 4.0 | 26 |
| Wyoming | 4.0 | 26 |
| North Carolina | 4.1 | 28 |
| Oregon | 4.2 | 29 |
| Rhode Island | 4.2 | 29 |
| Michigan | 4.3 | 31 |
| Georgia | 4.5 | 32 |
| Oklahoma | 4.5 | 32 |
| Connecticut | 4.6 | 34 |
| Washington | 4.6 | 34 |
| Arizona | 4.7 | 36 |
| New Jersey | 4.7 | 36 |
| Pennsylvania | 4.8 | 38 |
| Delaware | 4.9 | 39 |
| Nevada | 4.9 | 39 |
| New York | 4.9 | 39 |
| Illinois | 5.0 | 42 |
| California | 5.1 | 43 |
| Louisiana | 5.1 | 43 |
| West Virginia | 5.1 | 43 |
| Kentucky | 5.2 | 46 |
| Mississippi | 5.2 | 46 |
| Ohio | 5.3 | 48 |
| New Mexico | 6.2 | 49 |
| District of Columbia | 6.5 | 50 |
| Alaska | 7.2 | 51 |
Top 10 Metro Areas with the Lowest Unemployment Rate for September 2017
The top 10 Metropolitan areas with the lowest unemployment rate for the month of September 2017 are as follow:
- Fort Collins, CO
- Boulder, CO
- Fargo, ND-MN
- Bismarck, ND
- Greeley, CO
- Denver-Aurora-Lakewood, CO
- Idaho Falls, ID
- Dover-Durham, NH-ME
- Portsmouth, NH-ME; and
- Urban Honolulu, HI
If you are among the population who is currently unemployed and you are searching for jobs, we hope to have given you answers to all your questions on the unemployment situation.