In January, the total nonfarm payroll employment increased by 304,000 as compared to December which had an increase of 312,000 jobs. The unemployment rate has increased from 3.7 percent to 4 percent and this could be attributed to the Shutdown which lasted for 35 days from December 22, 2018, until January 25, 2019.
Household Survey Data
There has been a 0.3 percent increase in the unemployment rate and the number of people unemployed now stands at 6.5 million. Those that were impacted due to the partial federal government shutdown were reported as being on temporary layoff which has increased by 175,000. This figure includes those that were furloughed federal employees that were classified as unemployed during the temporary layoff.
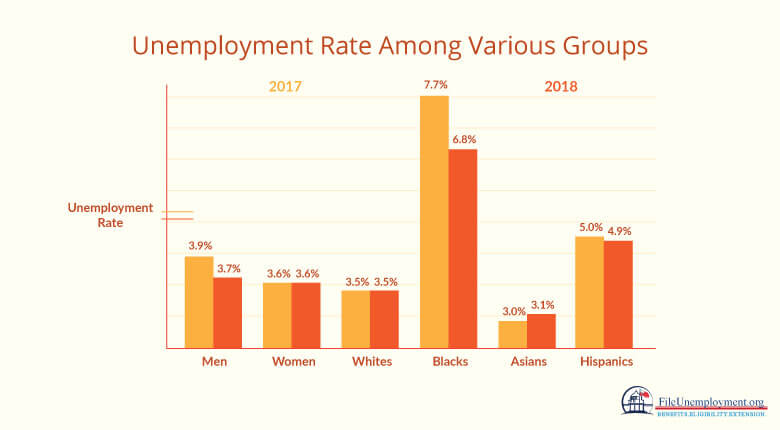
| Group | Unemployment Rate
(January 2018) |
Unemployment Rate
(January 2017) |
| Men | 3.7 | 3.9 |
| Women | 3.6 | 3.6 |
| Whites | 3.5 | 3.5 |
| Blacks | 6.8 | 7.7 |
| Asians | 3.1 | 3.0 |
| Hispanics | 4.9 | 5.0 |
When it comes to determining the unemployment of various groups, you can get a fair understanding of how the country has fared during the same period, in the previous year.
There was a little change in the number of long-term unemployed at 1.3 million and this accounted for 19.3 percent of unemployed individuals. The labor force participation rate was at 63.2 percent and the employment to population ratio is at 60.7 percent. These measures are up 0.5 percent over the year. Another important mention is that the number of people employed part-time has increased by one-half million to 5.1 million in January. Also, in January, 1.6 million people were marginally attached to the labor force which was unchanged from a year earlier. There were 426,000 discouraged workers in January and the remaining 1.2 million people were marginally attached to the labor force had not searched for work because of school attendance and family responsibilities.
Establishment Survey Data Total
The nonfarm payroll employment increased by 304,000 in January as compared to the average monthly gain of 223,000 in 2018. While in January, the employment grew in several industries like warehousing, transportation, construction, health care, and hospitality. There are no discernible impacts of the partial federal government shutdown for estimates based on earnings, hours or employment.
The employment rose in the hospitality and leisure by 74,000 while the job gains were mostly from food services and drinking places (37,000) and amusements, recreation and gambling which increased by 32000. Over the past year, leisure and hospitality alone added 410,000 jobs.
Another major contributor to job gains is through the special trade contractors which increased in both nonresidential (19,000) and residential components (15,000). Employment rose in the heavy and civil engineering construction by 10,000 and residential building by 9,000. In the past 12 months, 338,000 jobs were added in the construction sector.
In the health care industry, employment increased by 42,000 while the largest contributors were ambulatory health care services (22,000) and hospitals (19,000). Health care added 368,000 jobs over the past year and over the month, employment in transportation and warehousing rose by 27,000. Retail trade employment edged up by 21,000 while general merchandise stores lost 12,000 jobs.
The mining industry has added 64,000 jobs over the year as the employment increased by 7,000 in January. Professional and business services continue to trend up over the month and it has increased by 546,000 in the last 12 months. Manufacturing has seen an uptrend with 261,000 jobs being added over the year. There has been an increase of 20,000 jobs in durable goods while there is a decline of 7,000 in non-durable goods.
When it comes to employment in the Federal government, it has remained unchanged in January with an increase in 1,000 jobs. Federal employees on furlough during the partial government shutdown were counted as employed because they worked or received pay for the period that included 12th of the month.
Revised Data
The total nonfarm payroll employment for November was revised from 176,000 to 196,000 and the change for December was revised from 312,000 to 222,000. Based on these revisions, the employment gains in November and December combined were 70,000 more. This makes the job gains an average of 241,000 per month over the past three months.
This suggests that though there has been an increase in the number of jobs in several industries, the main job gainers in the industry were leisure and hospitality, construction, health care, and transportation and warehousing.
